Ingest Flood Extent Maps
Contents
Ingest Flood Extent Maps#
Last Modified: 07-04-2021
Authors: Nadia Ahmed, Gonzalo Mateo-García
Acquire flood metadata and floodmaps from Copernicus Emergency Management Service and retrieve co-located Sentinel-2 images and permanent water masks from the Google Earth Engine.
Overview#
In this notebook we will:
Examine a specific flood event
Build Flood MetaData and Floodmap using
area of interest (AOI)
observed flood event
hydrography areas
hydrography lines
Retrieve Sentinel-2 and JRC Permanent Water for a Flood AOI
1 - Flood Events#

Copernicus Emergency Management Service (EMS) provides warnings and risk assessment of floods and other natural disasters through geospatial data derived from satellite imagery. It provides data before, during, and after events in Rapid Mapping format for emergencies and Risk and Recovery format for prevention. In WorldFloods we are primarily interested in the satellite derived imagery with a focus on fluvial, or river, floods.
Copernicus EMS Rapid Activations#
The Copernicus EMS Activation Mappings for individual events given by unique EMSR codes may be accessed here. Linked to each EMSR code per severe event in the Rapid Activations table is the individual webpage for the EMSR code featuring vector zip files from various sources. Each vector zip file may contain multiple products with respect to an event. For this notebook, we will walk through a single EMSR flood event from the alert code, to its associated url.
We may retrieve a pandas DataFrame format of the EMS Rapid Activations table using the function table_floods_ems from the activations module in ml4floods/data. In this function you may specify how far back in time you would like to retrieve flood emergency mappings for. Be careful when choosing dates prior to 23 June 2015 when Sentinel-2 was launched into space.
# Install the ml4floods package
!pip install geemap
!pip install git+https://github.com/spaceml-org/ml4floods#egg=ml4floods
Collecting ml4floods
  Cloning https://github.com/spaceml-org/ml4floods to /tmp/pip-install-ccd3jpat/ml4floods_8eb3a646692647a49e9ba6678b10471c
  Running command git clone --filter=blob:none --quiet https://github.com/spaceml-org/ml4floods /tmp/pip-install-ccd3jpat/ml4floods_8eb3a646692647a49e9ba6678b10471c
^C
ERROR: Operation cancelled by user
import sys
import os

from ml4floods.data.copernicusEMS import activations
from ml4floods.data import utils
from pathlib import Path
Let’s take a look at the flood events that have occurred since the start of 2021.
table_activations_ems = activations.table_floods_ems(event_start_date="2021-01-01")
table_activations_ems
| Title | CodeDate | Type | Country | |
|---|---|---|---|---|
| Code | ||||
| EMSR568 | Cyclone Gombe in Mozambique | 2022-03-11 | Flood | Mozambique |
| EMSR567 | Floods in Queensland, Australia | 2022-02-26 | Flood | Australia |
| EMSR565 | Tropical Cyclone Emnati in Madagascar | 2022-02-22 | Storm | Madagascar |
| EMSR564 | Tropical Cyclone Batsirai in Madagascar | 2022-02-05 | Storm | Madagascar |
| EMSR563 | Tropical Cyclone BATSIRAI in Réunion | 2022-02-02 | Storm | Reunion |
| EMSR562 | Floods in Australia | 2022-01-29 | Flood | Australia |
| EMSR561 | Floods in Malawi | 2022-01-24 | Flood | Malawi |
| EMSR559 | Flood in Madagascar | 2022-01-18 | Flood | Madagascar |
| EMSR557 | Floods in Norway | 2022-01-13 | Flood | Norway |
| EMSR556 | Super Typhoon Rai, Philippines | 2021-12-13 | Storm | Philippines |
| EMSR555 | Flood in the Ebro river basin, Spain | 2021-12-10 | Flood | Spain |
| EMSR554 | Floods in Queensland, Australia | 2021-12-01 | Flood | Australia |
| EMSR552 | Windstorm in Norway | 2021-11-19 | Storm | Norway |
| EMSR551 | Flood in Sulaymaniyah District, Iraq | 2021-11-20 | Flood | Iraq |
| EMSR550 | Flood in New South Wales, Australia | 2021-11-10 | Flood | Australia |
| EMSR548 | Flood in Eastern Sicily, Italy | 2021-10-24 | Flood | Italy |
| EMSR520 | Flood in Netherlands | 2021-07-16 | Flood | Netherlands |
| EMSR519 | Flood in Switzerland | 2021-07-15 | Flood | Switzerland |
| EMSR518 | Flood in Belgium | 2021-07-14 | Flood | Belgium, Netherlands |
| EMSR517 | Flood in Western Germany | 2021-07-13 | Flood | Germany |
| EMSR514 | Flood in Guyana | 2021-06-07 | Flood | Guyana |
| EMSR511 | Flood in Lapland, Finland | 2021-05-20 | Flood | Finland |
| EMSR507 | Flood in Timor-Leste | 2021-04-04 | Flood | Timor-Leste |
| EMSR504 | Floods, Australia | 2021-03-19 | Flood | Australia |
| EMSR502 | Flood in Southern Ireland | 2021-02-23 | Flood | Ireland |
| EMSR501 | Flood in Albania | 2021-01-06 | Flood | Albania |
| EMSR498 | Flood in Corrèze department, France | 2021-02-02 | Flood | France |
| EMSR497 | Flood in Germany | 2021-02-01 | Flood | Germany |
| EMSR496 | Flood in Lazio Region, Italy | 2021-01-26 | Flood | Italy |
| EMSR495 | Tropical cyclone Eloise in Mozambique,... | 2021-01-22 | Storm | Mozambique, Eswatini, Zimbabwe |
| EMSR492 | Flood in Landes, France | 2021-01-01 | Flood | France |
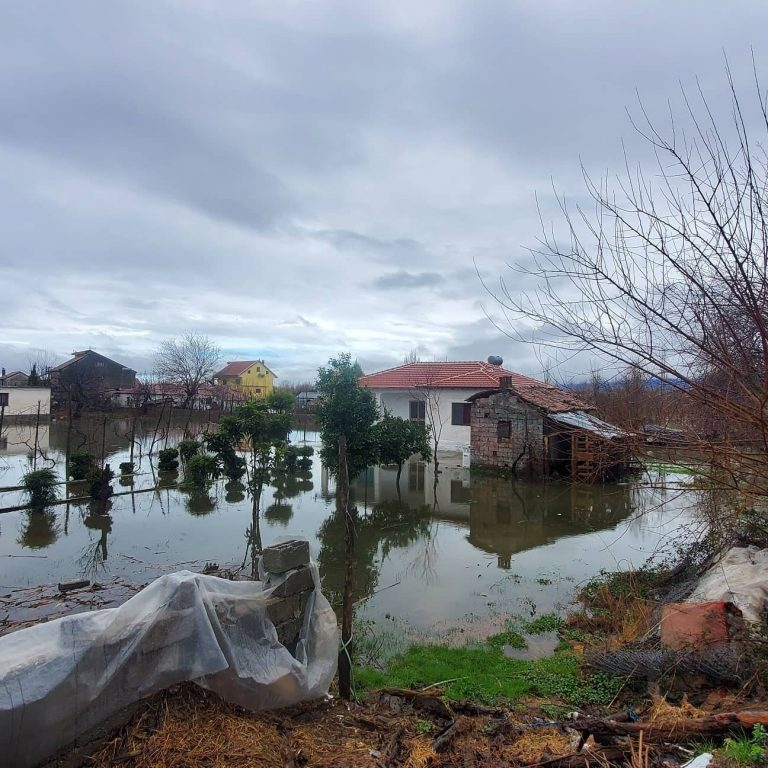
EMSR 501: Flood in Shkodra, Albania#
During heavy rains 4000 hectares of land was affected by flooding impacting 200 people. We take this event as an example to show how we retrieve and ingest data as an entry point to the preprocessed data used in the WorldFloods machine learning pipeline.
Retrieve the Zip File URLs for a given EMSR Code#
The Copernicus EMS Activation Mapping URL location for the January 6th flood event in Shkodra, Albania can be fetched using the activation code “EMSR501” and the function fetch_zip_files from activation.py which outputs the url locations as a list of strings. Each of these zip file urls allow us to retrieve the vector shapefiles for different areas of interest within a single activation code.
emsr_code = "EMSR501"
zip_files_activation_url_list = activations.fetch_zip_file_urls(emsr_code)
zip_files_activation_url_list
['https://emergency.copernicus.eu/mapping/download/184632/EMSR501_AOI01_DEL_MONIT02_r1_VECTORS_v1_vector.zip',
 'https://emergency.copernicus.eu/mapping/download/184615/EMSR501_AOI01_DEL_MONIT01_r1_VECTORS_v1_vector.zip',
 'https://emergency.copernicus.eu/mapping/download/184606/EMSR501_AOI01_DEL_PRODUCT_r1_VECTORS_v1_vector.zip']
Notice that this particular EMSR flood code has several area of interest (AOI) files. These files are present in the ml4cc_data_lake Google Cloud Storage bucket repository in their unzipped raw format as well as their zipped format. They can be found in the following locations:
zipped files: gs://ml4cc_data_lake/0_DEV/0_Raw/WorldFloods/copernicus_ems/copernicus_ems_zip
unzipped files: gs://ml4cc_data_lake/0_DEV/0_Raw/WorldFloods/copernicus_ems/copernicus_ems_unzip
Saving the Zip Files and Unzipping Locally#
If you would like to save the zip files locally, you may do so by downloading them directly from ml4cc_data_lake or by downloading the zip files directly from the Copernicus EMS rapid activations. Since this notebook goes over data ingestion from start to finish, we explain the process for both cases. To save the files locally we do the following:
from tqdm import tqdm
import os
folder_out = f"Copernicus_EMS_raw"
os.makedirs(folder_out, exist_ok=True)

unzip_files_activation = []
for zip_file in tqdm(zip_files_activation_url_list):
    local_zip_file = activations.download_vector_cems(zip_file,
                                                      folder_out=folder_out)
    unzipped_file = activations.unzip_copernicus_ems(local_zip_file,
                                                     folder_out=folder_out)
    unzip_files_activation.append(unzipped_file)
100%|████████████████████████████████████████████████████████████████████████████████████████████████████████████████████████████████████████████████████████████████████████| 3/3 [00:00<00:00, 332.11it/s]
	File https://emergency.copernicus.eu/mapping/download/184632/EMSR501_AOI01_DEL_MONIT02_r1_VECTORS_v1_vector.zip already exists. Not downloaded
	File https://emergency.copernicus.eu/mapping/download/184615/EMSR501_AOI01_DEL_MONIT01_r1_VECTORS_v1_vector.zip already exists. Not downloaded
	File https://emergency.copernicus.eu/mapping/download/184606/EMSR501_AOI01_DEL_PRODUCT_r1_VECTORS_v1_vector.zip already exists. Not downloaded
2 - Building EMSR Flood Metadata and Floodmaps#
Following the scraping and downloading of Copernicus EMS Rapid Mapping Products in, we unzipped the files in our local file directory or to the Google Cloud Storage Bucket.
Once unzipped, multiple .shp files can be associated with a single EMSR Flood Activation Code. These files represent different activation layer data available as Copernicus EMS rapid mapping products. For more details with respect to each of the layers see below.
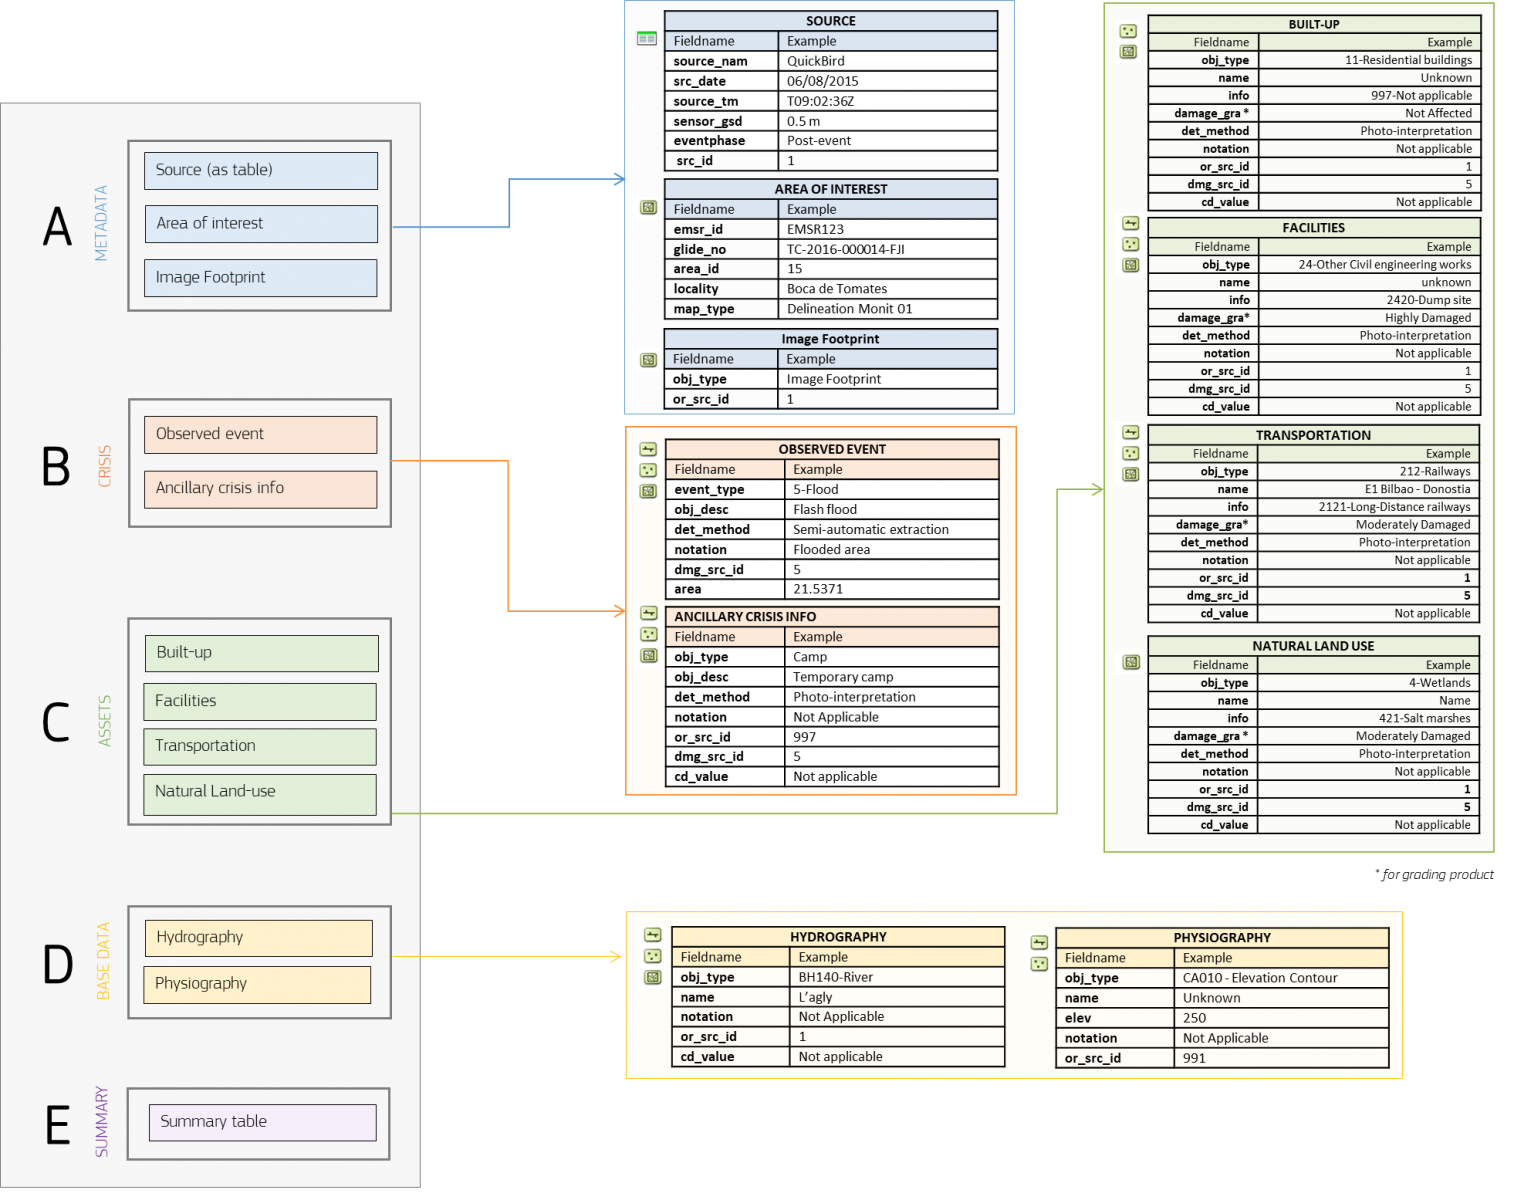
The layers of particular value to WorldFloods are the Metadata (A), Crisis (B), and Base Data (D) layers. More specifically, we are interested retrieving:
A: Source and The Area of Interest (AOI)
B: Observed Event data for Floods
D: Hydrography areas and lines indicative of lakes and rivers
With these data we can create a composite floodmask over an AOI. We will later obtain Sentinel-2 images associated with an AOI which we will overlay with a floodmap layer derived from A, B, and D Copernicus EMS products.
These shapefiles will be used to compose a floodmap for use in the generation of ground truth labels to be used in a supervised learning model pipeline.
2a - Process Shapefiles#
In function filter_register_copernicusems we check that all the .shp follow the expected conventions with respect to timestamp and data availability.
2b - Populate Copernicus EMSR Metadata Dictionary#
filter_register_copernicusems upon extracting the source, AOI, observed event, and hydrography information, will populate a dictionary with keys associated with the source data and hold the filenames and paths of specific .shp files as values.
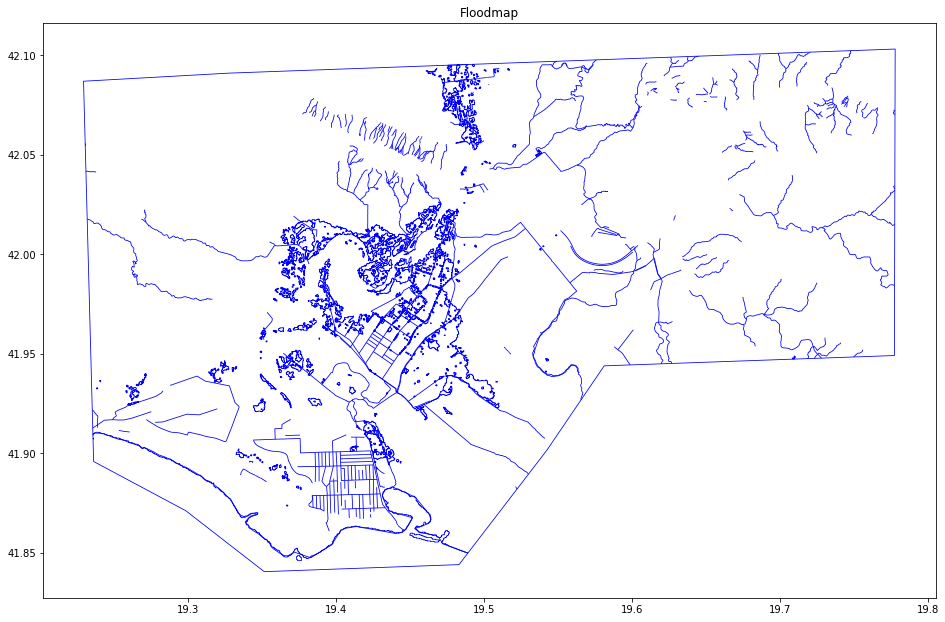
2c - Generate Floodmap#
We then process the .shp files area of interest, observed event, and the hydrography into a single geopandas.GeoDataFrame object using generate_floodmap. This information will be uploaded to the WorldFloods data bucket for new events.
# folder_out=f"Copernicus_EMS_raw/{activation}"

code_date = table_activations_ems.loc[emsr_code]["CodeDate"]

registers = []
for unzip_folder in unzip_files_activation:
    metadata_floodmap = activations.filter_register_copernicusems(unzip_folder, code_date)
    if metadata_floodmap is not None:
        floodmap = activations.generate_floodmap(metadata_floodmap, folder_files=unzip_folder)
        registers.append({"metadata_floodmap": metadata_floodmap, "floodmap": floodmap})
        print(f"File {unzip_folder} processed correctly")
    else:
        print(f"File {unzip_folder} does not follow the expected format. It won't be processed")
/home/gonzalo/git/ml4floods/ml4floods/data/utils.py:39: ShapelyDeprecationWarning: The 'cascaded_union()' function is deprecated. Use 'unary_union()' instead.
  land_geometries = cascaded_union(land_geometries.tolist())
File Copernicus_EMS_raw/EMSR501_AOI01_DEL_MONIT02_r1_VECTORS_v1_vector processed correctly
/home/gonzalo/git/ml4floods/ml4floods/data/utils.py:39: ShapelyDeprecationWarning: The 'cascaded_union()' function is deprecated. Use 'unary_union()' instead.
  land_geometries = cascaded_union(land_geometries.tolist())
File Copernicus_EMS_raw/EMSR501_AOI01_DEL_MONIT01_r1_VECTORS_v1_vector processed correctly
File Copernicus_EMS_raw/EMSR501_AOI01_DEL_PRODUCT_r1_VECTORS_v1_vector processed correctly
/home/gonzalo/git/ml4floods/ml4floods/data/utils.py:39: ShapelyDeprecationWarning: The 'cascaded_union()' function is deprecated. Use 'unary_union()' instead.
  land_geometries = cascaded_union(land_geometries.tolist())
floodmap.head()
| geometry | w_class | source | |
|---|---|---|---|
| 0 | POLYGON ((19.49257 42.09545, 19.49258 42.09541... | Flooded area | flood |
| 1 | POLYGON ((19.51681 42.09338, 19.51681 42.09329... | Flooded area | flood |
| 2 | POLYGON ((19.50074 42.09272, 19.50074 42.09263... | Flooded area | flood |
| 3 | POLYGON ((19.50933 42.09266, 19.50933 42.09257... | Flooded area | flood |
| 4 | POLYGON ((19.50763 42.09290, 19.50763 42.09281... | Flooded area | flood |
import numpy as np
np.unique(floodmap.source)
array(['area_of_interest', 'flood', 'hydro', 'hydro_l'], dtype=object)
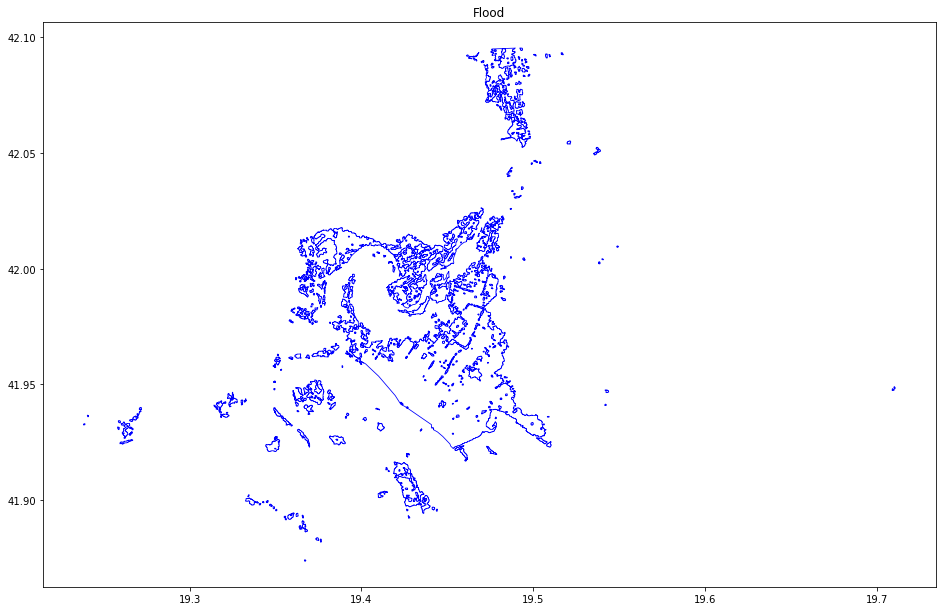
import matplotlib.pyplot as plt
# initialize figure
fig, ax = plt.subplots(figsize=(16,16))
floodmap[floodmap["source"] == "flood"].plot(ax=ax, facecolor="None", edgecolor="blue", label="Flood Maps", linewidth=0.8)
ax.set(
    title="Flood"
)
plt.show()
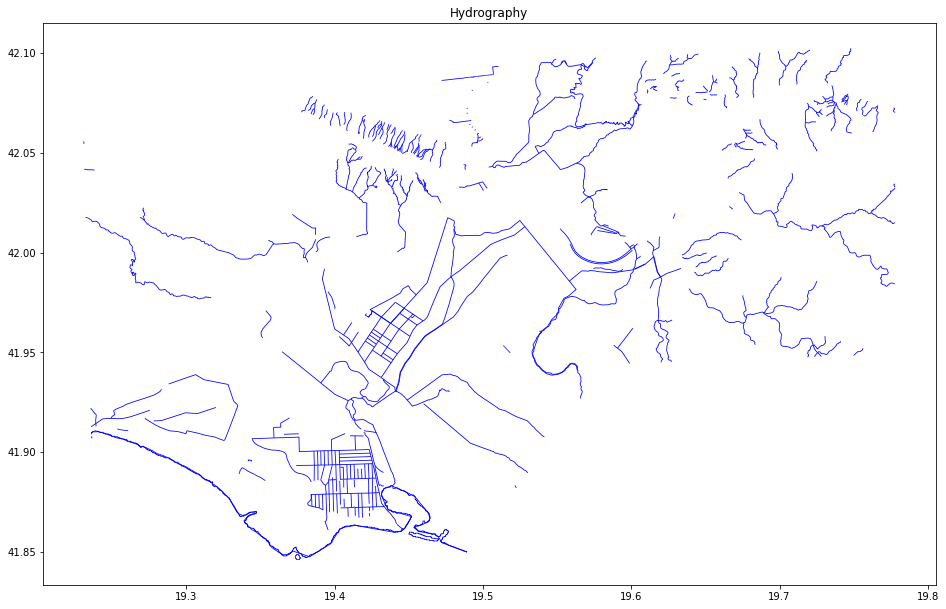
import matplotlib.pyplot as plt
# initialize figure
fig, ax = plt.subplots(figsize=(16,16))
floodmap[floodmap["source"] == "hydro_l"].plot(ax=ax, facecolor="None", edgecolor="blue", label="Flood Maps", linewidth=0.8)
ax.set(
    title="Hydrography"
)
plt.show()
import matplotlib.pyplot as plt
# initialize figure
fig, ax = plt.subplots(figsize=(16,16))
floodmap[floodmap["source"] != "hydro"].plot(ax=ax, facecolor="None", edgecolor="blue", label="Flood Maps", linewidth=0.8)
ax.set(
    title="Floodmap"
)
plt.show()
metadata_floodmap
{'event id': 'EMSR501_AOI01_DEL_PRODUCT',
 'layer name': 'EMSR501_AOI01_DEL_PRODUCT_observedEventA_r1_v1',
 'event type': 'Flash flood',
 'satellite date': Timestamp('2021-02-12 16:32:21+0000', tz='UTC'),
 'country': 'NaN',
 'satellite': 'Sentinel-1',
 'bounding box': {'west': 19.238301964000073,
  'east': 19.710555657000043,
  'north': 42.095451798000056,
  'south': 41.873487114000056},
 'reference system': 'epsg:4326',
 'abstract': 'NaN',
 'purpose': 'NaN',
 'source': 'CopernicusEMS',
 'area_of_interest_polygon': <shapely.geometry.polygon.Polygon at 0x7f56811326d0>,
 'observed_event_file': 'EMSR501_AOI01_DEL_PRODUCT_observedEventA_r1_v1.shp',
 'area_of_interest_file': 'EMSR501_AOI01_DEL_PRODUCT_areaOfInterestA_r1_v1.shp',
 'ems_code': 'EMSR501',
 'aoi_code': 'AOI01',
 'date_ems_code': datetime.datetime(2021, 1, 6, 0, 0, tzinfo=datetime.timezone.utc),
 'satellite_pre_event': 'Open Street Map',
 'timestamp_pre_event': Timestamp('2021-02-12 00:00:00+0000', tz='UTC'),
 'hydrology_file': 'EMSR501_AOI01_DEL_PRODUCT_hydrographyA_r1_v1.shp',
 'hydrology_file_l': 'EMSR501_AOI01_DEL_PRODUCT_hydrographyL_r1_v1.shp'}
metadata_floodmap["area_of_interest_polygon"]

3 - Sentinel-2 and JRC Permanent Water Imagery Using Google Earth Engine#
Sentinel-2 Image Retrieval Using Google Earth Engine#
To retrieve Sentinel-2 images from Google Earth Engine, make sure you create an account and authenticate prior to running the cell below. The link to sign up is here.

To query and download the Sentinel-2 images we will use the module ee_download and interact with the map using geemap.eefolium.
We use the AOI polygons retrieved from CopernicusEMS to select the location and time that we are interested in and use Google Earth Engine to do the georeferencing. Notice that we may also render the hydrography and observed flood event.
from datetime import timedelta
from datetime import datetime
import geopandas as gpd
import pandas as pd
import ee
import geemap.eefolium as geemap
import folium
from ml4floods.data import ee_download, create_gt
from shapely.geometry import mapping
!earthengine authenticate
ee.Initialize()

bounds_pol = activations.generate_polygon(metadata_floodmap["area_of_interest_polygon"].bounds)
pol_2_clip = ee.Geometry.Polygon(bounds_pol)

pol = ee.Geometry(mapping(metadata_floodmap["area_of_interest_polygon"]))

date_event = datetime.utcfromtimestamp(metadata_floodmap["satellite date"].timestamp())

date_end_search = date_event + timedelta(days=20)

# Grab the S2 images and the Permanent water image
img_col = ee_download.get_s2_collection(date_event, date_end_search, pol)
permanent_water_img = ee_download.permanent_water_image(date_event.year, pol_2_clip)


# Get info of the Image Collection (convert to table)
img_col_info = ee_download.img_collection_to_feature_collection(img_col,
                                                               ["system:time_start", "valids", "cloud_probability"])
img_col_info_local = gpd.GeoDataFrame.from_features(img_col_info.getInfo())
img_col_info_local["system:time_start"] = img_col_info_local["system:time_start"].apply(lambda x: datetime.utcfromtimestamp(x/1000))

n_images_col = img_col_info_local.shape[0]
print(f"Found {n_images_col} S2 images between {date_event.isoformat()} and {date_end_search.isoformat()}")

# Plot images using geemap
Map = geemap.Map()

imgs_list = img_col.toList(n_images_col, 0)
for i in range(n_images_col):
    img_show = ee.Image(imgs_list.get(i))
    Map.addLayer(img_show.clip(pol),
                 {"min":0, "max":3000,
                  "bands":["B4","B3","B2"]},
                 f"({i}/{n_images_col}) S2 RGB {img_col_info_local['system:time_start'][i].strftime('%Y-%m-%d')}",
                 False)
    Map.addLayer(img_show.clip(pol),
                 {"min":0, "max":3000,
                  "bands":["B11","B8","B4"]},
                 f"({i}/{n_images_col}) S2 SWIR/NIR/RED {img_col_info_local['system:time_start'][i].strftime('%Y-%m-%d')}",
                 True)

# Viz permanent water layer
visualization = {
  "bands": ['waterClass'],
  "min": 0.0,
  "max": 3.0,
  "palette": ['cccccc', 'ffffff', '99d9ea', '0000ff']
}

Map.addLayer(permanent_water_img, visualization, name="JRC Permanent water")


floodmap_folium = folium.features.GeoJson(floodmap, name="FloodMap")
Map.add_child(floodmap_folium,name="FloodMap")

# Map.addLayer(pol, {"color": 'FF000000'}, "AoI")

Map.centerObject(pol, zoom=10)
folium.LayerControl(collapsed=False).add_to(Map)
Map
Found 8 S2 images between 2021-02-12T16:32:21 and 2021-03-04T16:32:21
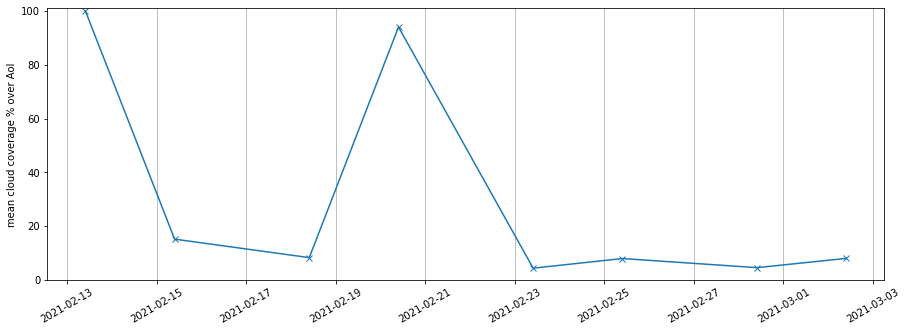
Show the metadata of the Sentinel-2 files#
In the previous cell we show how query images from the GEE and show them with geemap. In that code we query the metadata of the Sentinel-2 files which is a DataFrame object. The metadata includes the mean cloud coverage of the images.
img_col_info_local
| geometry | cloud_probability | system:time_start | valids | |
|---|---|---|---|---|
| 0 | POLYGON ((-180.00000 -90.00000, 180.00000 -90.... | 100.000000 | 2021-02-13 09:48:54.985 | 1 |
| 1 | POLYGON ((-180.00000 -90.00000, 180.00000 -90.... | 15.191459 | 2021-02-15 09:38:58.363 | 1 |
| 2 | POLYGON ((-180.00000 -90.00000, 180.00000 -90.... | 8.315460 | 2021-02-18 09:48:53.845 | 1 |
| 3 | POLYGON ((-180.00000 -90.00000, 180.00000 -90.... | 94.017820 | 2021-02-20 09:38:59.706 | 1 |
| 4 | POLYGON ((-180.00000 -90.00000, 180.00000 -90.... | 4.401171 | 2021-02-23 09:48:55.862 | 1 |
| 5 | POLYGON ((-180.00000 -90.00000, 180.00000 -90.... | 7.978288 | 2021-02-25 09:38:58.740 | 1 |
| 6 | POLYGON ((-180.00000 -90.00000, 180.00000 -90.... | 4.595103 | 2021-02-28 09:48:55.012 | 1 |
| 7 | POLYGON ((-180.00000 -90.00000, 180.00000 -90.... | 8.042142 | 2021-03-02 09:39:00.135 | 1 |
import matplotlib.pyplot as plt

plt.figure(figsize=(15,5))
plt.plot(img_col_info_local["system:time_start"], img_col_info_local["cloud_probability"],marker="x")
plt.ylim(0,101)
plt.xticks(rotation=30)
plt.ylabel("mean cloud coverage % over AoI")
plt.grid(axis="x")
Export one of the images to Google Drive#
BANDS_EXPORT = ["B1","B2","B3","B4", "B5", "B6", "B7", "B8", "B8A", "B9", "B10", "B11", "B12", "QA60", "probability"]

# Download SECOND! image (index 1)
i = 1
date_i = img_col_info_local['system:time_start'][i]
img_export = ee.Image(imgs_list.get(i))

print(f"Download image from date {date_i}")
img_export = img_export.select(BANDS_EXPORT).toFloat().clip(pol)

# Name of the file in your Google Drive
filename_noext = "ml4floods_flood_albania"

# use  ee.batch.Export.image.toStorage to export it to a gcp bucket
task = ee.batch.Export.image.toDrive(img_export,
                                     fileNamePrefix=filename_noext,
                                     description=filename_noext,
                                     crs='EPSG:4326',
                                     skipEmptyTiles=True,
                                     # bucket="ml4floods",
                                     scale=10,
                                     formatOptions={"cloudOptimized": True},
                                     fileDimensions=12544,
                                     maxPixels=5e9)
task.start()
The method status() of the task instance gets you the status of the exporting task. Once the state is FINISHED you will see the TIF file in your Google Drive folder.
Google Earth Engine tasks can be also monitored with the task manager.
task.status()
{'state': 'RUNNING',
 'description': 'ml4floods_flood_albania',
 'creation_timestamp_ms': 1617123790366,
 'update_timestamp_ms': 1617123855192,
 'start_timestamp_ms': 1617123840398,
 'task_type': 'EXPORT_IMAGE',
 'attempt': 1,
 'id': 'PHODTJSJBMOPVZVJL7S5HS6E',
 'name': 'projects/earthengine-legacy/operations/PHODTJSJBMOPVZVJL7S5HS6E'}
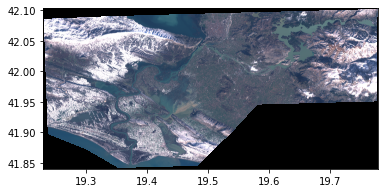
Read image from Google Drive#
Warning: This part is only available in Google Colab; to download the file to your local computer you can use the gdown package.
from google.colab import drive
drive.mount('/content/drive')
from ml4floods.visualization import plot_utils

plot_utils.plot_rgb_image("/content/drive/My Drive/ml4floods_flood_albania.tif", size_read=600)
<AxesSubplot:>